

 |
 |
|
|
CO2 Sensor Network
When the classroom reduces us to imbeciles
Who has not experienced the drag of being in a classroom? There are times when
you just would like to say stop and leave. There are of course many
causes for such feelings. But, the environment you are in is a big factor. You
can point at the social environment, where you may feel uncomfortable with your
classmates. The dynamics of a group of people is always fragile and hard work.
The other factor is the physical environment. This can be the visual and
interior design of the classroom, but also the environmental properties like
temperature and gaseous content.A recent project highlighted the physical environment, where pupils (17...20 years of age) were {t}asked to "Solve a problem at school". In other words, look at your school environment in the broadest sense, identify a problem and design a fix for it. Several groups focussed on the air quality in the classroom, which many experienced as poor. The hypothesized main culprit: CO2. This is where the first measurements were taken using a CCS811 sensor. This is a relatively cheap but fragile sensor, which does not measure CO2 directly, but uses a calculation on volatile organic compounds to estimate the air quality and returns an equivalent CO2 value. This is hardly a real gas measurement, but it suffices to get a good indication of the air quality in a room. Conclusion: The air is really, really, really bad. So, project done, you think... Well, no. Now I am interested in quantifying the real problem and to document it in the process. There may be a problem far beyond the perceived air quality and it can impact the individual pupil's performance. Are we still within the bounds of the rules for air quality? If not, then something should be done about it. And here the engineer is at an advantage. We simply build a rig and quantify the problem with objective measurements. But more on that later. Lets see what the literature says. After a bit of research I found a paper from 2016 from Allen et.al. with the convoluted title "Associations of Cognitive Function Scores with Carbon Dioxide, Ventilation, and Volatile Organic Compound Exposures in Office Workers: A Controlled Exposure Study of Green and Conventional Office Environments" published in Environmental Health Perspectives DOI:10.1289/ehp.1510037 (open access; marked as public domain). And that was exactly what was required to support any measurements. The publication includes several figures (reproduced below), which should send shivers down your spine, if you ever were required to be in a room with bad air quality while being tasked with something important. It is obvious, from looking at figure 1, that air quality has a huge impact on cognitive function. Better air quality results in better performance; it is as simple as that. The major important factors in education are focussed activity, information usage and strategy. These three ensure that pupils will get to the bottom of a problem and find the proper solutions. And, if all goes well, learn something in the process 🤔 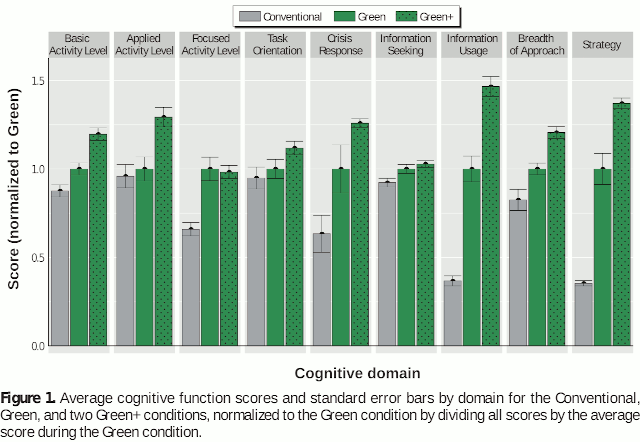 The picture becomes even more interesting, when only CO2 is considered, which figure 2 shows. The absolutely scary part of figure 2 is the level of CO2 required to suppress (effective) use of information and the strategies required to handle the information. At a level of 1500 ppm we are in disarray and reduced to imbeciles. At these levels, Lucy may outsmart us all (no, not the movie). 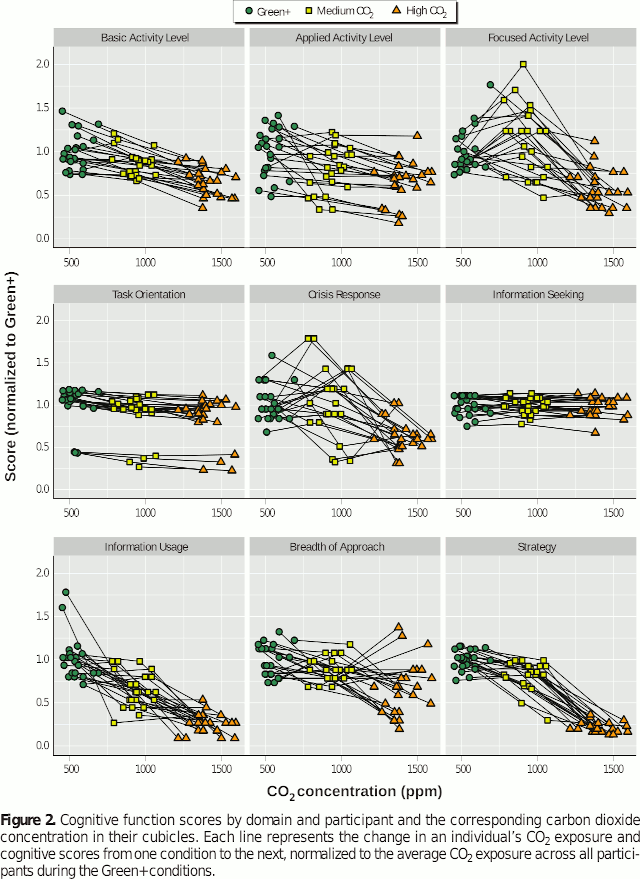
The real question that comes into mind is: How many pupils have had lower grades, not because they lack the capacity,
but the physical learning environment, i.e. air quality, was at their
disadvantage?
That is, of course, a tricky question. However, when the relation between air quality and cognitive function is so clear, then it is a legitimate question to pose. The answer is not something I particularly look forward to. Mainly because I suspect a rather depressing result if we were to analyse enough data. Building a measurement rigTraditionally, real CO2 sensors have been very expensive. Cheap alternatives do not measure CO2 directly, but use some derivative measurement and a calculation to return some equivalent value, which may or may not be usable or accurate. Newer technology has resulted in a relatively cheap CO2 sensor from Sensirion, the SCD30. This sensor costs about $58 (or about €52 and much cheaper in bulk). It uses an optical measurement and measures CO2 content directly using NDIR at a CO2 specific wavelength. The SCD30 also includes a hygrometer and a temperature sensor.All in all, we want to have a more complete set of environmental data. The sensors used:
The idea is to have a sensor network, where multiple setups collect data and send it to a central server. From there additional analysis can be performed such as statistics and long-term graphs. 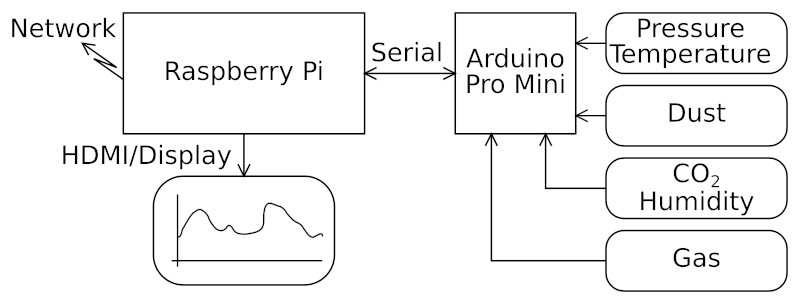 At the time of writing, three sensor sets are installed in three different rooms. The whole setup involves a Raspberry Pi (two version 2 and one version 3) and a small interface PCB with an Arduino Pro Mini (3.3 V). 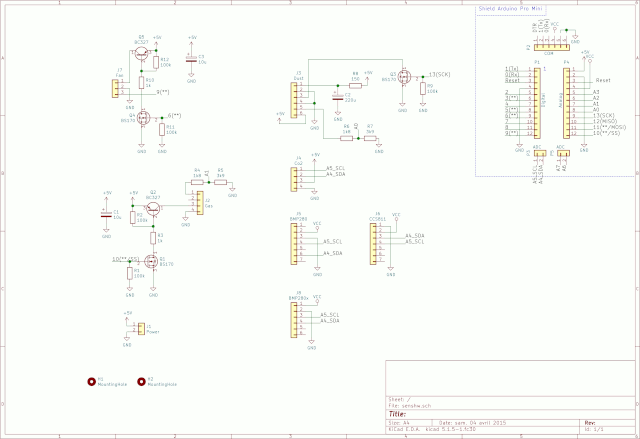 Please note: Not all connectors match the pin-layout of the attached sensors. The reason is in the different sources for the sensors, where pin-layouts were different between the modules. This is fixed in the cabling. If you make this, then you must be careful not to wire things reversed or sensors are bound to give you Magic Smoke instead of data. The design has two BMP280 connectors on the PCB with rather different pinouts to accommodate modules from different sources. The sensor board PCB is used to collect the data at one second interval. The Arduino is used because a) the particulate content sensor is rather timing sensitive and b) all collected data is simply sent over the serial line as a packet of data, which reduces the complexity of the software on the RPi. The Raspberry Pi runs a minimal install of Raspbian with a bare-bone X-server installed. No window-manager or desktop environment is running. A QT-application runs the show from there. Only two of the three installations have a screen attached. The filesystem is set to read-only to prevent the SD-card from destroying itself. The system is setup such way that it automatically starts everything required after boot using a custom systemd service. It should be noted that running X on a read-only filesystem is a challenge because Xauth and Xorg logs are a pain. You need to set userid and the XAUTHORITY environment variable in the systemd service and symlink to tmpfs filesystems to solve the problem. There are several other setup problems you need to take care of with a read-only setup. You may find this several places on the web and work your way through it from there. [FIXME: need to make a list of changes here when I find the time]. The code is available and you are expected to have experience with C/C++, PHP, SQL, web interfaces, RPi and Linux (yes, this is a badly documented hack project, where "Use the Source, Luke" is of paramount importance): The qsensview tarball includes the systemd service (move to /lib/systemd/system/) and the xsession (move to /home/pi/.xsession), which need to be installed at the proper places. The systemd service will start the X-server with the appropriate privileges as user 'pi'. You may also want to disable the ssh-agent (see /etc/X11/Xsession.options). The Arduino sketch is crude data collecting code. There is a serial interface to set calibration values, which are saved in EEPROM. Data is sent every second to the qsensview application and its data order/format is configured in the qsv.ini file. If, for whatever reason, no data is collected by qsensview, then it is able to reset the Arduino. A GPIO pin from the RPi is connected to the DTR line, which may reset the Arduino. Normally, the code should run fine, but the I2C communication and the driver code may include bugs. Just like the main code may be flawed. Using the ATmega watchdog may fail due to interactions with the bootloader (needs to be very slow to get across the bootloader delay). The qsensview code detects if no data is received or all zeros. You can call this fixing the symptom, which is entirely correct, but a lot easier and faster to implement <insert appropriate smiley here>. The database is Postgresql and stores all data sent through a REST-API. You will need to populate the database (see sensdb.plsql) and define your rooms. There is a .htaccess file involved to route the calls accordingly. The data storing API call requires an API key, which is a hash of a database set key and some data. Have a look at the code to see how that works. It is a crude hack and not very secure (it works like a pre-shared key). But, high security was not the point. It simply needs to filter valid from invalid requests. You may want to use pwqgen to create a lot of fine phrases. The web graphing front-end uses some jquery and Chart.js. You will need to edit the PHP sources, according to where and how you establish your apache server. Setup in the physical world: S05 - electronics lab - The dust sensor has no fan in this image and the Arduino cannot be reset. This was the first setup created using a RPi2 and the readout is on a 28" dumpster-dive recovered TV-screen with HDMI and located over the door to a storage room (clearly visible throughout the room). The fan is now mounted but the software has not been updated to the latest version. A typical case of "if it ain't broken, don't fix it". The CO2 sensor must be recalibrated (has a systemic offset, see below) and the display needs to be realigned. A RPi3 reported the TV-screen as 1280x720, but the RPi2 set its interface to 1276x716. These 4 missing pixels causes the time-axis text to be abbreviated on the left side graphs. Either overscan must be enabled or the window must be moved left/up by two pixels. 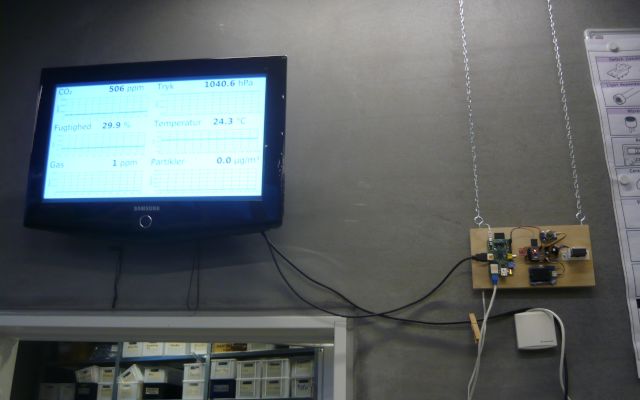 U2 - generic classroom - The second installation that made a lot of small fixes necessary. It runs with a RPi3 and the standard 7" RPi-display+touch. The screen layout only shows one graph at a time with a tabbed view. Both multiple and tabbed graphs are supported by qsensview. The tab-text does show the current measurement values. The backlight dims automatically to about 20% after a minute. That makes the display much less intrusive. Touching the screen will up the backlight to max. The setup is located next to the white-board and clearly visible for all. The Gas-sensor needs to be recalibrated to be useful. All other values are fine. The image was taken 7 minutes after class start in the morning. You can see how steep the CO2 curve rises. 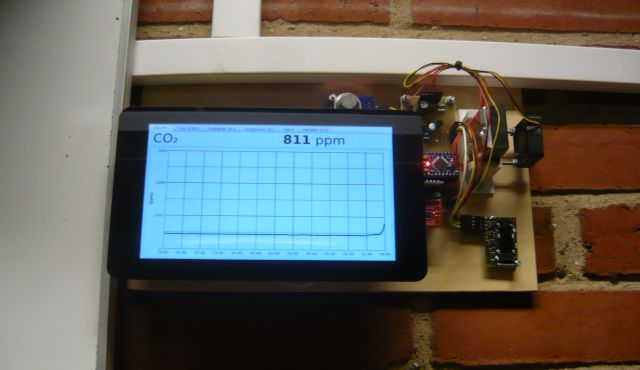
U17 - generic classroom - The third installation is yet to be mounted on the wall next to the white-board. It is essentially the same as the one in U2, but uses a RPi2 and has no display. Currently, it resides in the closet, in the corner of the room. The closet door is open all the time. The placement is sub-optimal, but it turns out to be a non-issue with respect to the measurement results. I imagine, that at some stage, I'll get a comment "when are you gonna fix this setup?". That'll be when I have some spare time and the room is not in use. See, it is a hack project. 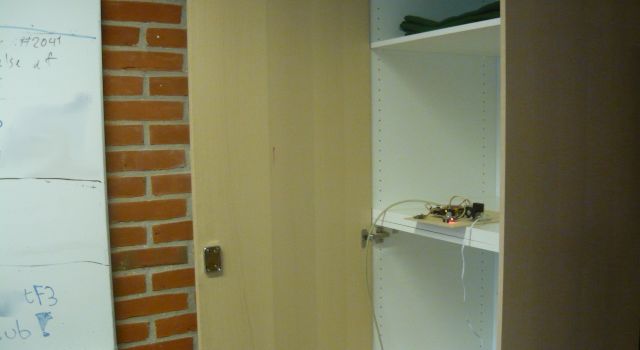 Results from the CO2 measurementsThe sensor values are aggregated at one minute interval and stored. The backing database also contains a table with all the scheduled hours, where the measured rooms are in use. Some SQL magic can then be used to calculate statistics from all that information, which gives an overview of what is going on.The total time indicated is the accumulated time where measurements exist and the room was used/occupied according to the schedule. Measurement start for the rooms are:
Room U2 - used for generic classes (with 34 pupils): 
Total time: 8753 minutes.
Time over 1000 ppm: 5195 minutes (59%)
Time over 1250 ppm: 3557 minutes (41%)
Time over 1500 ppm: 2328 minutes (27%)
Time over 1750 ppm: 1280 minutes (15%)
Time over 2000 ppm: 514 minutes (6%)
Room U17 - used for generic classes (with 23 pupils): 
Total time: 3655 minutes.
Time over 1000 ppm: 2330 minutes (64%)
Time over 1250 ppm: 374 minutes (10%)
Time over 1500 ppm: 251 minutes (7%)
Time over 1750 ppm: 219 minutes (6%)
Time over 2000 ppm: 193 minutes (5%)
Room S05 - electronics lab (varying between 10...57 pupils): 
Total time: 5280 minutes.
Time over 1000 ppm: 2 minutes (0%)
Time over 1250 ppm: 1 minutes (0%)
Time over 1500 ppm: 0 minutes (0%)
Time over 1750 ppm: 0 minutes (0%)
Time over 2000 ppm: 0 minutes (0%)
Note to the CO2 value in S05, which goes below 400 ppm: The setup in S05 was the first established and a bug in the code would send zeros, which was not detected. Therefore, some values fall in the 0-249 bucket. This has been fixed, but the data is now established and I'd rather not change it. Also, the CO2 values are consistently 35 ppm lower than the other sensors. The reason is the auto-calibration feature of the SCD30, which was not disabled at first. Therefore, the sensor recalibrated itself with a systemic offset. An analysis of the data shows that this has no significant impact on the statistics because the room is very well ventilated, even with many people in the room. The measurements are still within the ±10% range. The conclusion is clear. The lab S05 is properly ventilated, whereas rooms U2 and U17 are completely inadequate. Actually, both U2 and U17 are even worse than shown because a display in U2 shows the current CO2 level and is clearly visible. The pupils in U17 are using the statistics page to keep an eye on the current levels. When the level rises too much, the pupils themselves will open doors and windows (even if that means getting cold). And still, the room's air quality is extremely poor. The room U17 has a long tail and went up to 3350 ppm. This one occasion made sure that the pupils now keep an eye on the current values and act accordingly. The below image (click to enlarge) shows what happened in U17 at the day, where the pupils became very interested in keeping the room ventilated. Most were quite shocked to see the graph, but could relate the air quality to how they performed. The curves identify where door and window are opened. The speed at which the curves move up and down depends on the activity level, how many windows are opened and the general flow through the corridors. 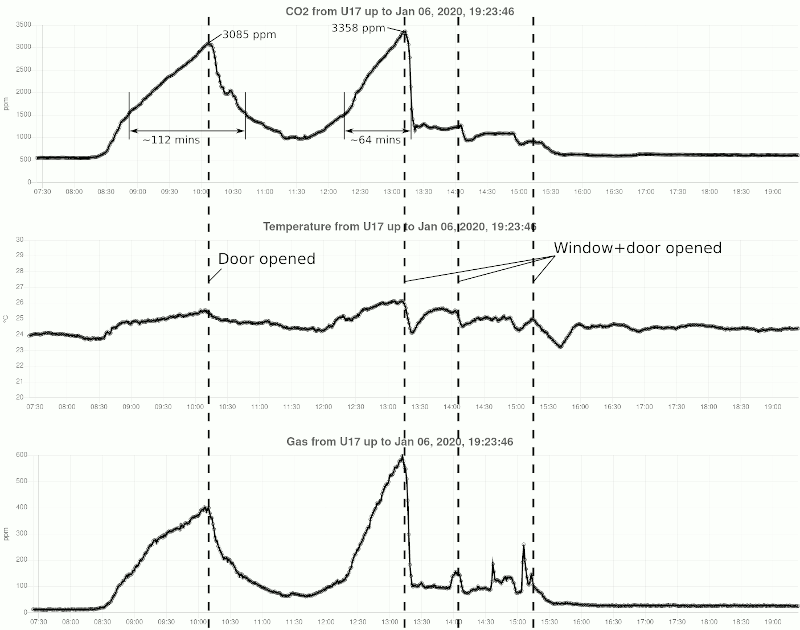 You can compare that to an image for S05 at a day where 45+ pupils are located at the electronics lab with the doors closed all the time. The only comment here would be that it gets relatively warm in the room (≈26 °C). The room performs very well all the time, even when accounting for the systemic offset in the CO2 measurement of about 35 ppm. 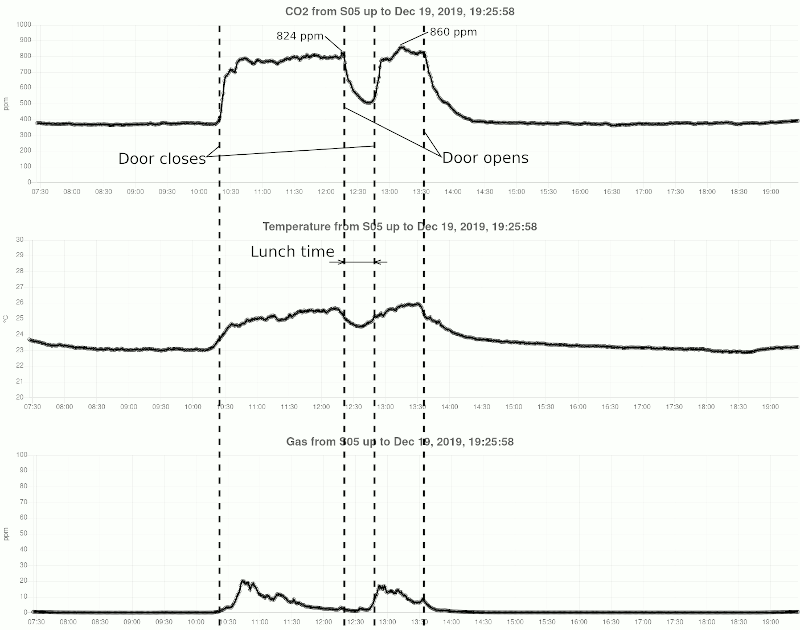 A similarly bad example for U2 is shown below. The CO2 level does not fall below 1500 ppm for the whole afternoon. They try to ventilate the room at some intervals, which can be seen by the drop in both CO2 and temperature. However, it is simply not enough. Please note that the Gas measurement in U2 is not functional because its calibration values are too far off (it needs to be aligned with the other stations). 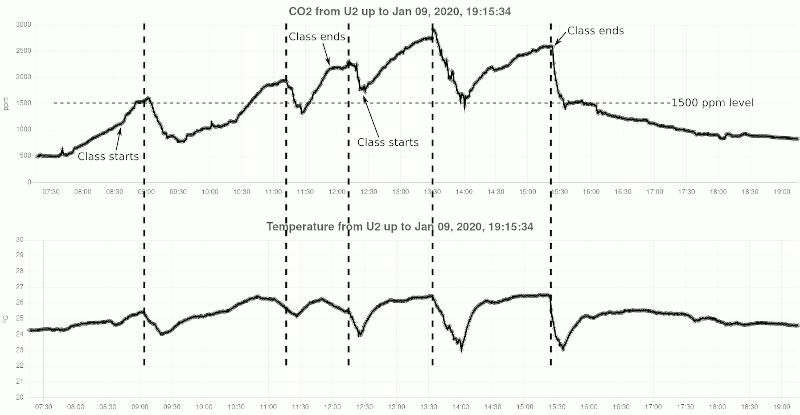 The lab at S05 and most of the rooms in the Sxx wing are located in a new building (built 2012/2013). It shows that the design did one thing right, keeping air quality at acceptable levels. The Ux rooms are in the old original building (1970'ies) and lacks ventilation. And, when saying "lacks" it means: has no ventilation at all. The U1x rooms are newer (about 10 years), but are still inadequately ventilated. Both U2 and U17 have seen CO2 levels of over 1500 ppm over prolonged time. This would be much worse if the pupils were not able to see the current level of CO2. I petty the pupils in the other Ux and U1x rooms, where no measurements are performed. Imagine, with the knowledge of the introduction, the pupils in room U2 are more than a quarter of the time exposed to CO2 levels that cause poor information usage and poor strategy. The impact on learning is open to speculation, but I suspect it not to be a pretty picture. A note with respect to the rules. It is stated in this country that CO2 content should be kept below 1000 ppm. If the air contains more that 2000 ppm during the day for more than "short periods", then the ventilation is inadequate. There is a specific rule for institutions for children that requires the air in a room to be exchanged twice every hour (three times per hour for buildings after 1995). According to these rules, both U2 and U17 have inadequate ventilation. If the doors and windows were not opened at regular intervals, then the CO2 values would go through the roof. The rules make a remark about "natural ventilation". It can be argued, that opening doors and windows are natural ventilation. However, in a teaching setting, this is a poor substitute for proper ventilation. A lot of time is spent watching air quality, where focus should be on teaching. And then, opening the doors and windows with 10 °C or lower outside temperatures is not a particular pleasure. [It has been known for several years that the levels of CO2 can become very high in these rooms. A previous project (2016 or 2017 IIRC), without the knowledge of most pupils, has measured CO2 levels exceeding 5000 ppm. And still no action to fix the problem]
Posted: 2020-01-20 |
| Overengineering @ request | Prutsen & Pielen since 1982 |